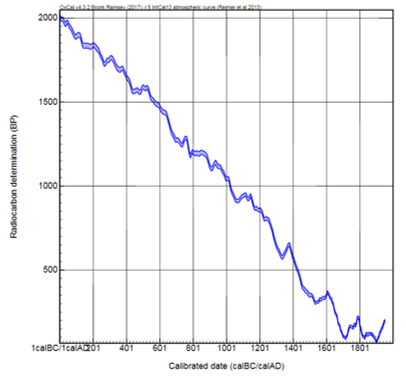
Several programs are available to convert a radiocarbon abundance value to a calendar age (see list at the bottom of this page). Calibration curves are necessary for calculation of a calendar age due to fluctuations in atmospheric radiocarbon production and abundance over time. Though over the long term, pre-bomb atmospheric production balanced decay, short term perturbations in production and cycling interjected "wiggles" into the record of historical atmospheric and marine radiocarbon abundances. These disturbances include sunspots, the earth's geomagnetic shield strength, changes in ocean-atmosphere exchange rates, and fossil fuel emissions. Image 1 illustrates the IntCal 2013 atmospheric radiocarbon calibration curve as related to standard radiocarbon age (Reimer et al., 2013). If not for factors influencing radiocarbon production and cycling, the curve would be a straight line.
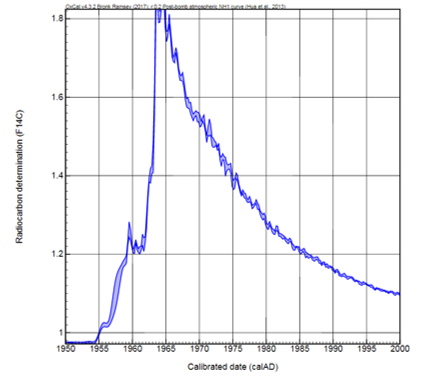
Above ground testing of nuclear weapons in the 1950's and 1960's caused a spike in atmospheric radiocarbon abundance commonly referred to as the bomb curve, and radiocarbon produced by weapons testing is referred to as bomb C. Detonation of these bombs releases thermal neutrons which were absorbed by nitrogen atoms to form carbon 14. This is the same production reaction that occurs in the outer stratosphere naturally, only the source of the neutrons is different. Image 2 depicts the calibration curve for the northern hemisphere post-bomb period.
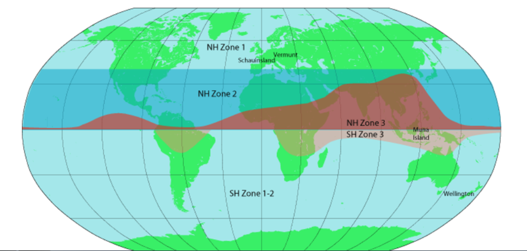
Because bomb C was not even distributed across the globe, Different calibration curves are necessary for different zones. Image 3 depicts the different calibration zones for post-bomb samples.
Online calibration programs:
CALIBomb: http://calib.org/CALIBomb/
OxCal: https://c14.arch.ox.ac.uk/oxcal.html
CALIB: http://calib.org/calib/